Information on the 2018 Marsden Fund round

Information about the number of funded proposals in the 2018 Marsden Fund round broken down by research area and institution, also including gender and ethnicity data
Number of applications by research area
The number of proposals by panel is given in Table 1. While overall 12.4% of the Expressions of Interest have been recommended for funding at the final stage, this percentage is not constant over all panels or categories as a change of just one proposal — attributed to either a Fast-Start or Standard award — in the number of successful proposals causes significant change in this percentage.
Here are the definitions of the 10 Marsden Fund panels
|
EoIs |
Full |
Proposed Contracts |
Success Rate |
|||||||||
|
FS |
STD |
Tot. |
FS |
STD |
Tot. |
FS |
STD |
Tot. |
FS |
STD |
Tot. |
|
|
Panel |
||||||||||||
|
BMS |
28 |
92 |
120 |
7 |
18 |
25 |
3 |
10 |
13 |
10.7% |
10.9% |
10.8% |
|
CMP |
18 |
66 |
84 |
7 |
16 |
23 |
4 |
8 |
12 |
22.2% |
12.1% |
14.3% |
|
EEB |
42 |
83 |
125 |
12 |
20 |
32 |
5 |
9 |
14 |
11.9% |
10.8% |
11.2% |
|
EHB |
45 |
71 |
116 |
15 |
20 |
35 |
6 |
8 |
14 |
13.3% |
11.3% |
12.1% |
|
EIS |
39 |
76 |
115 |
12 |
16 |
28 |
6 |
8 |
14 |
15.4% |
10.5% |
12.2% |
|
ESA |
31 |
67 |
98 |
10 |
18 |
28 |
5 |
7 |
12 |
16.1% |
10.4% |
12.2% |
|
HUM |
38 |
55 |
93 |
15 |
15 |
30 |
6 |
7 |
13 |
15.8% |
12.7% |
14.0% |
|
MIS |
34 |
72 |
106 |
11 |
15 |
26 |
5 |
8 |
13 |
14.7% |
11.1% |
12.3% |
|
PCB |
17 |
65 |
82 |
6 |
17 |
23 |
3 |
8 |
11 |
17.6% |
12.3% |
13.4% |
|
SOC |
66 |
94 |
160 |
25 |
25 |
50 |
10 |
10 |
20 |
15.2% |
10.6% |
12.5% |
|
Total |
358 |
741 |
1099 |
120 |
180 |
300 |
53 |
83 |
136 |
14.8% |
11.2% |
12.4% |
Table 1: Number of funded proposals by panel (and as a percentage of number of EOIs).
Proposals by institution
|
|
EoIs |
|
|
Full |
|
|
Fund |
|
Success Rate |
||||
|
FS |
SD |
MFCA |
FS |
SD |
MFCA |
FS |
SD |
MFCA |
FS |
SD |
MFCA |
Total |
|
|
CRI |
35 |
60 |
1 |
10 |
12 |
0 |
4 |
3 |
0 |
11.4% |
5.0% |
0.0% |
7.3% |
|
AgResearch |
2 |
8 |
1 |
0 |
0 |
0 |
0 |
0 |
0 |
0.0% |
0.0% |
0.0% |
0.0% |
|
GNS Science |
10 |
19 |
|
4 |
4 |
|
1 |
1 |
|
10.0% |
5.3% |
|
6.9% |
|
ESR |
1 |
2 |
|
1 |
0 |
|
0 |
0 |
|
0.0% |
0.0% |
|
0.0% |
|
NIWA |
10 |
13 |
|
3 |
1 |
|
2 |
1 |
|
20.0% |
7.7% |
|
13.0% |
|
Plant and Food Research |
7 |
8 |
|
1 |
4 |
|
1 |
1 |
|
14.3% |
12.5% |
|
13.3% |
|
Scion |
2 |
2 |
|
0 |
0 |
|
0 |
0 |
|
0.0% |
0.0% |
|
0.0% |
|
Manaaki Whenua Landcare Research |
3 |
8 |
|
1 |
3 |
|
0 |
0 |
|
0.0% |
0.0% |
|
0.0% |
|
OTHER (6 institutions) |
1 |
9 |
|
0 |
2 |
|
0 |
1 |
|
0.0% |
11.1% |
|
10.0% |
|
PRIVATE (13 institutions) |
6 |
15 |
|
1 |
2 |
|
1 |
0 |
|
16.7% |
0.0% |
|
4.8% |
|
TEO |
316 |
657 |
3 |
109 |
164 |
0 |
48 |
79 |
0 |
15.2% |
12.0% |
0.0% |
13.0% |
|
Auckland University of Technology |
17 |
18 |
|
4 |
3 |
|
1 |
3 |
|
5.9% |
16.7% |
|
11.4% |
|
Lincoln University |
1 |
10 |
|
0 |
2 |
|
0 |
0 |
|
0.0% |
0.0% |
|
0.0% |
|
Massey University |
49 |
67 |
1 |
20 |
11 |
0 |
9 |
6 |
0 |
18.4% |
9.0% |
0.0% |
12.8% |
|
The University of Auckland |
90 |
177 |
1 |
29 |
40 |
1 |
13 |
17 |
0 |
14.4% |
9.6% |
0.0% |
11.2% |
|
Unitec New Zealand |
3 |
1 |
|
0 |
0 |
|
0 |
0 |
|
0.0% |
0.0% |
|
0.0% |
|
University of Canterbury |
25 |
55 |
|
9 |
12 |
|
4 |
4 |
|
16.0% |
7.3% |
|
10.0% |
|
University of Otago |
56 |
169 |
1 |
21 |
52 |
1 |
12 |
29 |
0 |
21.4% |
17.2% |
0.0% |
18.1% |
|
University of Waikato |
25 |
43 |
|
10 |
8 |
|
4 |
3 |
|
16.0% |
7.0% |
|
10.3% |
|
Victoria University of Wellington |
49 |
114 |
|
16 |
36 |
|
5 |
17 |
|
10.2% |
14.9% |
|
13.5% |
|
Whitireia New Zealand |
|
1 |
|
|
0 |
|
|
0 |
|
|
0.0% |
|
0.0% |
|
Institute of the Pacific United |
1 |
|
0 |
|
0 |
|
0.0% |
|
|
0.0% |
|||
|
Manukau Institute of Technology |
|
1 |
|
|
0 |
|
|
0 |
|
|
0.0% |
|
0.0% |
|
WINTEC |
|
1 |
|
|
0 |
|
|
0 |
|
|
0.0% |
|
0.0% |
|
Grand Total |
358 |
741 |
4 |
120 |
180 |
2 |
53 |
83 |
0 |
14.8% |
11.2% |
0.0% |
12.3% |
Table 2: Number and percentages of funded proposals by institution, grouped by type of institution. The ‘Other’ category includes not-for-profit research institutes and the ‘Private’ category includes individuals and companies.
Gender and Ethnicity Data
Table 3 presents the percentages of applicants who self-identify as either female or as Māori researchers in the Expressions of Interest, Full Applications and those proposals recommended for funding.
|
Investigators Identifying |
Investigators Identifying |
||
|
Principal |
EoIs |
3.9% |
36.4% |
|
Full |
7.4% |
42.5% |
|
|
Funded |
9.3% |
42.1% |
|
|
Associate |
EoIs |
4.8% |
30.1% |
|
Full |
7.7% |
33.9% |
|
|
Funded |
10.6% |
35.5% |
|
|
All |
EoIs |
4.4% |
32.8% |
|
Full |
7.6% |
37.3% |
|
|
Funded |
10.1% |
38.1% |
Table 3: Gender and ethnicity data for 2018. Please note, gender identity data is collected in accordance with Stats NZ's Standard classification of gender identity.
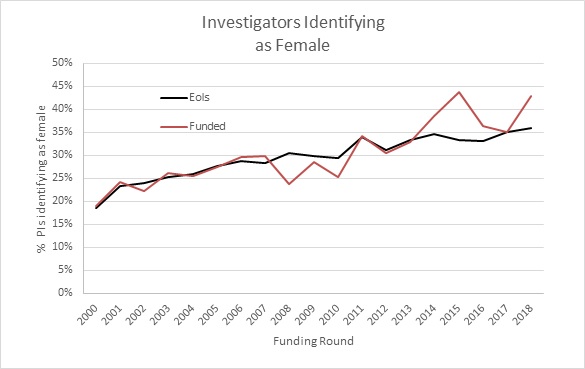
Figure 1: The percentage of Principal Investigators identifying as Female in the Marsden Fund.
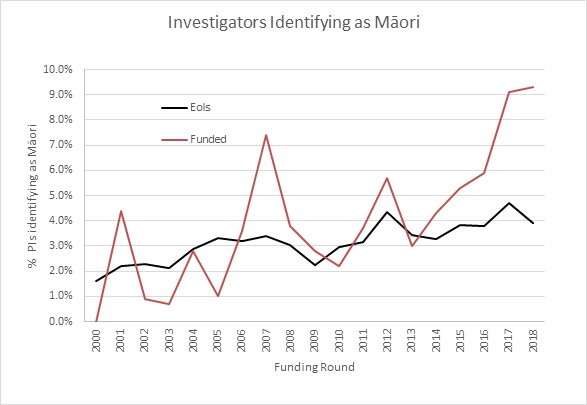
Figure 2: The percentage of Principal Investigators identifying as Māori in the Marsden Fund.