Voting and fairness

Voting in the general election is an important way for New Zealanders to have a say in a fair future.
Voting enables people to help determine the country’s future direction by showing their support for a party’s policies on key issues, such as climate change, taxation, and housing.
Leading up to the 2020 election, Te Tapeke Fair Futures Panel has been taking a look at voting in Aotearoa New Zealand through a lens of fairness.
The following information explores three main areas of our electoral system:
New Zealand’s general election voting system in a nutshell
If you’re a citizen or permanent resident of New Zealand aged 18 years or over, you are eligible to enrol to vote.
You can enrol on the General Roll or, if you are of Māori descent, you can choose to be on the General Roll or the Māori Roll.
Since 1996, New Zealanders vote under an MMP (Mixed Member Proportional) system, which consists of two votes:
- A party vote for the political party you want to be in government.
- An electorate vote for the candidate you would like to be the Member of Parliament for the area you live in.
Who can vote?
Citizens or permanent residents of New Zealand aged 18 years or over can vote.
This means that ethnic groups with relatively young populations have less of a say in Aotearoa’s future than others [1]. For example, Māori and Pacific populations have proportionally more individuals aged under 18 than other populations, such as Pākehā and Asian.
The graph below highlights the age distribution of different New Zealand population groups. European and Asian populations have a similar proportion of people under 18 years old: 22.5% and 24% respectively. In contrast, 37.6% of Māori and 39.6% of Pacific peoples are aged under 18.
New Zealand populations under age 18
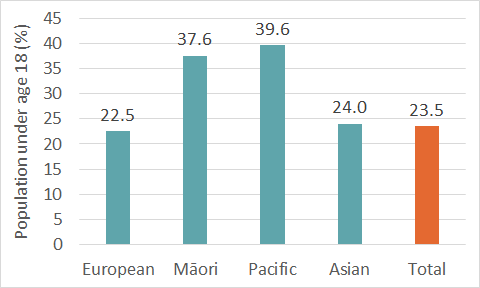
Figure 1. Percentage of the European, Māori, Pacific, Asian and total populations under the age of 18. Data from the 2018 New Zealand Census [1].
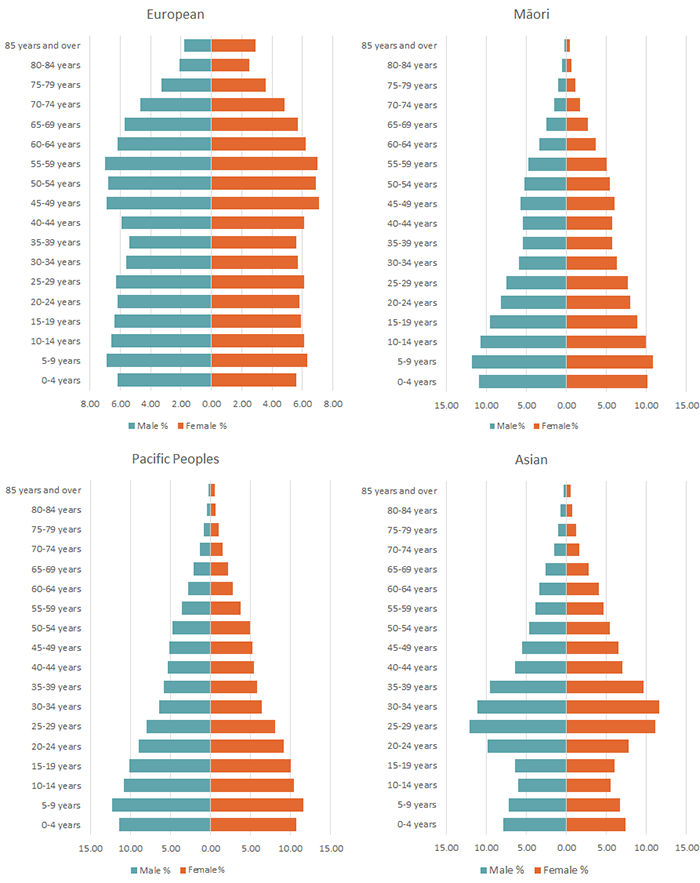
The graphs below show this age distribution in more detail. From the different shapes, you can see a bulge of older people in the European population, a bulge of middle-aged people in the Asian population, and bulges of young people in the Māori and Pacific populations.
Age distribution in New Zealand
The high proportion of young people in Māori and Pacific populations in New Zealand affects the voting power of these groups. Māori make up 16.5% of the population but only 13.5% are 18 and over and eligible to vote. Pacific peoples make up 8.1% of the population, but only 6.4% are 18 and over and eligible to vote.
Eligible voting populations in New Zealand
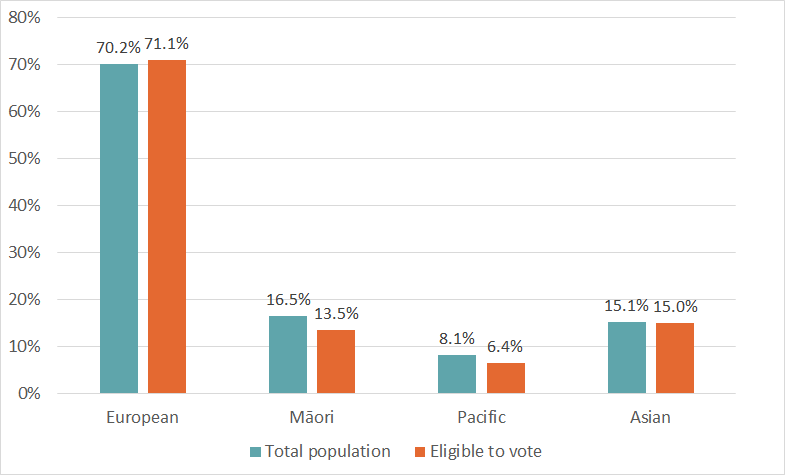
Figure 3. Share of the total population and the population eligible to vote who are European, Māori Pacific, or Asian. Totals add up to over 100% because people can identify with more than one ethnic group. Data from the 2018 New Zealand Census [1].
Is a lower voting age fairer?
Recently, there has been commentary about whether it’s fair that only those aged 18 and over can vote.
Lowering the voting age from 18 to 16 could create the opportunity to decrease this gap in voting power of ethnic groups with a younger population.
Voting on behalf of tamariki children
Some people have also suggested that parents should be given additional votes, depending on how many children they have. The idea is that this would allow them to more fairly represent the interests of the next generation. This is called Demeny Voting.
Voters living overseas
Some New Zealand citizens and residents who live overseas are eligible to vote. Over 68,000 New Zealanders living overseas were enrolled to vote as of 30 September 2020. [2]
Internationally, there is debate about whether or not it is fair for citizens and residents living overseas to vote in their home country’s elections. For example, overseas voters might not be paying tax in their home country, but their vote influences policy for the people currently living there.
Only 23,515 (38%) of New Zealanders enrolled overseas voted in the 2017 general election.
Who does vote?
Not everyone who is eligible to vote actually does vote. Therefore, not everyone who could do so is having a say about fair futures in New Zealand.
Young people have an especially low voter turn-out. But income and length of time residing in New Zealand are also factors.
Age and voting behaviour
Younger people are less likely to enrol to vote, and also less likely to vote once enrolled.
With this in mind, how will the global trend of aging populations in most countries affect the outcome of voting in future?
For example, some commentators have said that older people determined younger people’s future in the United Kingdom’s referendum on leaving the European Union: more old people wanted to leave than young people, and older voters voted in greater numbers.
Young and old voters may bring different perspectives to the way they vote. Young voters may vote to influence emerging issues, such as climate change, while older people may vote to protect infrastructure and systems developed during their lifetime.
By voting, young people have a stronger say in what they see as a fair future.
Fewer young people enrol to vote
When we look at enrolment data from the last six elections, we can see that people aged from 18 to 29 years have the lowest enrolment rates of all the age groups.
Voter enrolments by age group
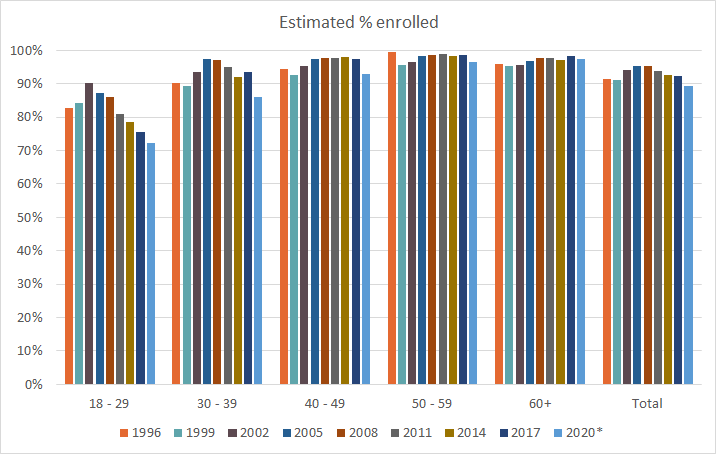
Figure 4. National enrolment statistics by age band for general elections under MMP. *Data last updated September 2020, provided by the New Zealand Electoral Commission.
Fewer young people vote
The graph below shows the age groups of New Zealanders who voted in the 2017 election. Fewer than 50% of those aged 18 to 24 voted, compared with more than 80% of those 55 and older. The highest voter turn-out was of those aged 65 to 69, at approximately 86%.
Voting by age, 2017 election
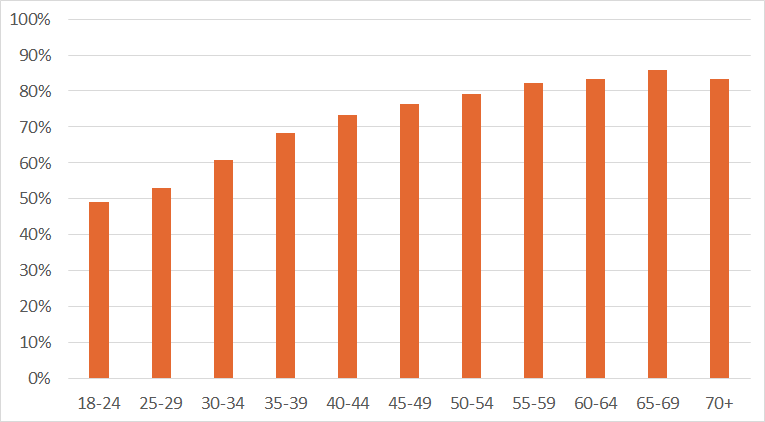
Figure 5. Voting in the 2017 election by age. Data from the New Zealand Electoral Commission and Stats NZ population estimates by age for September 2017.
Other groups that vote less
The latest General Social Survey (GSS) showed that income affected how likely a person was to vote in New Zealand, as did how long a person had lived here:
‘The more a person’s income meets their everyday needs, the more likely they were to vote. Of people who had more than enough money to meet their everyday needs, 91 percent voted. This compared with 76 percent of those who did not have enough money to meet their daily needs.’
‘Migrants were more likely to have voted in the general election the longer they had lived in New Zealand. Only 54 percent of migrants who had lived in New Zealand less than five years voted, compared with 89 percent of migrants who had lived in New Zealand 15 years or more.’ StatsNZ
How does voter power differ by electorate?
To see how age and other factors affect electorate voting power, it is useful to compare electorates. Electorates in New Zealand are designed to contain roughly the same number of people (both adults and children). But between electorates, numbers of people who are eligible to vote, enrolled to vote, and who actually do vote vary substantially. Note that in the MMP system, it is the party vote that counts towards the number of Members of Parliament (MPs) from each party who get into parliament.
The graph below shows party votes cast by electorate in the 2017 election. There were 45,616 votes cast in the Rodney electorate on Auckland’s North Shore, which has an older population (median age 44.7). This compares with 28,024 votes cast in the – younger – Manakau East electorate, South Auckland (median age 29.9). By casting almost 18,000 more votes, people in Rodney had a greater influence on who got into parliament than people in Manakau East – despite the two electorates representing approximately the same population size.
The seven Māori electorates had the least votes cast of all electorates. The median age of the electorates was under 26 in all seven of the Māori electorates in 2017.
The three general roll electorates with the least votes cast were South Auckland electorates with a high proportion of young Pacific populations: Māngere, Pacific population 55.0%, median age 27.9; Manukau East, 41.4%, median age 29.9; and Manurewa, 33.3%, median age 29.1.
Electorate populations and voting behaviour
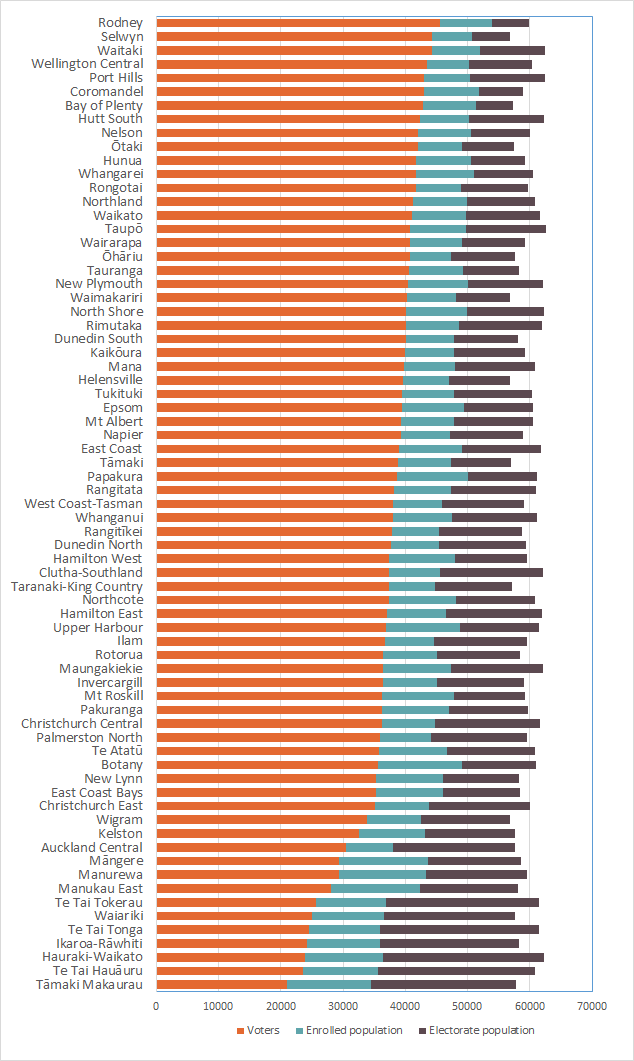
Figure 6. Electorate populations, populations enrolled to vote, and party votes cast, 2017. Data from the 2013 New Zealand Census and the New Zealand Electoral Commission.
Improving voter turn-out
Improving voter turn-out would help reduce the difference in voting power between electorates and different ethnic groups in New Zealand. Currently, promotional campaigns encourage people to enrol and vote. Another possible approach to improving voter turn-out is to make voting compulsory – like in Australia.
Voting for a fairer future
In the past, not all New Zealanders over 18 have had an equal right to vote, with groups achieving suffrage at different times. In future, if there are calls for further changes to the voting system in New Zealand, these would also have to be approved by legislation. For example, the First Past the Post (FPP) system was changed by the Electoral Act 1993 to the Mixed Member Proportional (MMP) system we use today.
In the meantime, the most important thing is that everyone who can vote, does vote. So, if you’re 18 and over, enrol and vote in the election! Have a say in a fair future.
[1] While there are quality concerns over 2018 Census data, data on age are rated ‘very high’ quality, and the young age structure of Māori and Pacific peoples has been noted elsewhere.

