Research
Published 11 September 2023Shining a Light on Economic Inequality

In this Marsden-funded project, Professors John Gibson and Xiangzheng Deng know that where people live/work is critical to public policy and economic research
Rising economic inequality is a global issue impacting individual well-being and national stability/productivity.
Overcoming economic inequality is a key sustainable development goal (number 10) set by the United Nations (https://sdgs.un.org/goals). So how are nations measuring up to this goal? Most countries release economic inequality data only at the national and provincial level. However, local, district council-like, levels of economic inequality are often unreported in these data sets. These economic blind-spots have flow on effects to essential public services for example – electricity/water supply, staffing (medical/teacher) and in understanding changes to local wellbeing. One-way researchers improve the accuracy of local economic data is by using ‘’big data’’ taken from satellites passing over a region of interest at night.
Traditionally, satellite data comes from the Defense Meteorological Satellite Program (DMSP), originally developed to gather information for USA military operations. Once state-of-the-art, DMSP is showing its age, assigning light and therefore economic activity to unlit areas in the wilderness. Newer satellite programs, such as VIIRS Night Lights (VNL) and NASA’s Black Marble (BM) use more modern sensors and data-processing methods to detect night-time lights with greater accuracy. Surprisingly, these more accurate data sources are largely ignored by studies attempting to measure inequality.

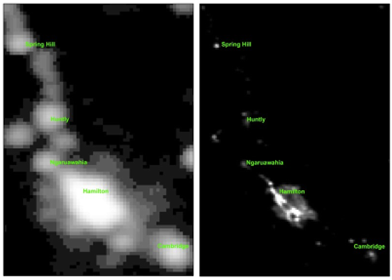
A nice example of the differences between DMSP and VIIRS - in the night skies above the Waikato region. DMSP (older satellite system) and VIIRS (modern satellite system) are on the left and right, respectively. Figure provided by Professor Gibson.
Supported by their Marsden-funded project, Professors John Gibson (University of Waikato), Xiangzheng Deng (Chinese Academy of Sciences) and Xiaoxuan Zhang (University of Waikato) compared the performance of DMSP and VNL data for estimating economic inequality. In their study, they used two decades of annual data from over 5000 counties in China and the United States – the two largest countries with benchmark data on economic activity down to the county level.
To provide clear visual evidence they start by examining the USA state of Wisconsin, which is conveniently bordered on two sides by water and sparse populations that minimize outside light interference. Population and economic activity are concentrated in 22 counties in the southeast of this state, near the largest city, Milwaukee, and the capital city, Madison. These counties generate 74% of state GDP, are home to 69% of the population and emit two-thirds of luminosity according to the VIIRS Night Lights (VNL) night-time lights data.
The widely-used Defense Meteorological Satellite Program (DMSP) paints a very different picture. Unlit areas appear illuminated in blurry DMSP images. Just 47% of light detected by the DMSP is in the southeast corner. Most of the light detected is instead in the sparsely populated parts of the state with less economic activity. Notably, small towns like Oshkosh seem as brightly lit as Milwaukee. The upshot of these discrepancies is that the popular DMSP data results in vast underestimates of economic inequality across the state; when estimated from DMSP data, the Gini coefficient (a common measure of inequality) for Wisconsin is only half of what is estimated using VNL data.
To show the generalised nature of these biases, the team also estimated spatial inequality for all county-level spatial units in China and the United States. For the United States, DMSP data underestimated some inequality measures by 60%, compared to what benchmark Gross Domestic Product (GDP) data show. In contrast, there was no underestimation of inequality with the newer VNL data. Results for China showed similar patterns. Furthermore, trends in levels of inequality over time were also distorted using DMSP data. For example, from 2000 to 2013 the Theil inequality index (a statistic used to measure economic inequality) was estimated to have fallen 28% when using DMSP data, but this predicted fall was not observed when using GDP or VNL data. This apparent fall in inequality could cause policymakers to be too optimistic about the success of their efforts in reducing China’s regional inequality.
For more information please check out this paper * Xiaoxuan Zhang, John Gibson and Xiangzheng Deng “Remotely too equal: Popular DMSP night-time lights data understate spatial inequality” Regional Science Policy and Practice (2023, early view) https://doi.org/10.1111/rsp3.12716
RESEARCHER
Professor John Gibson
ORGANISATION
Te Whare Wānanga o Waikato | University of Waikato
CONTRACT OR PROJECT ID
UOW1901
